INCF endorses the MBF Bioscience neuromorphological file format
We are pleased to announce that the International Neuroinformatics Coordinating Facility (INCF) has endorsed the MBF Bioscience neuromorphological file format as
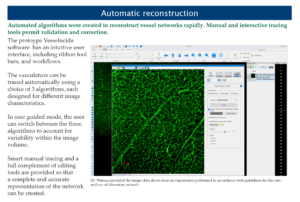
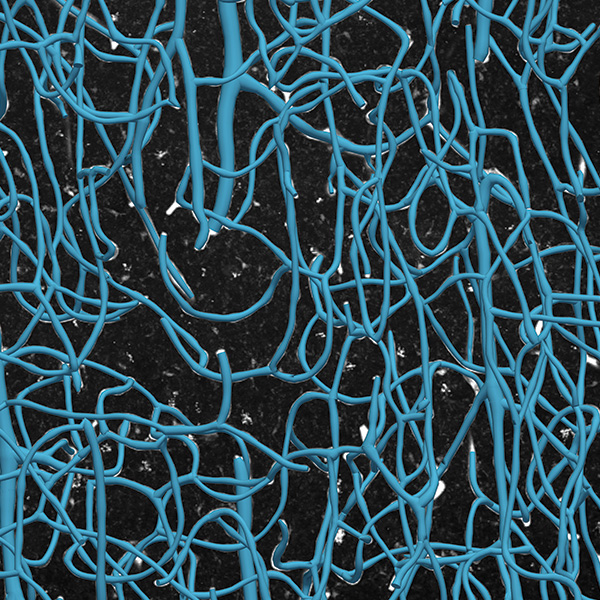
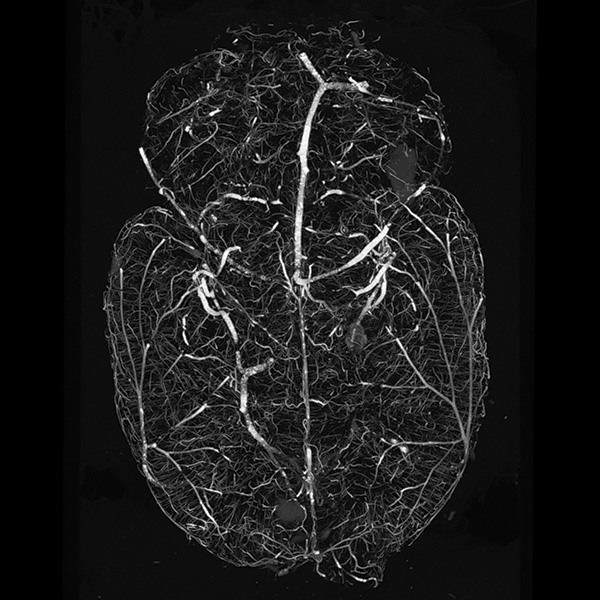
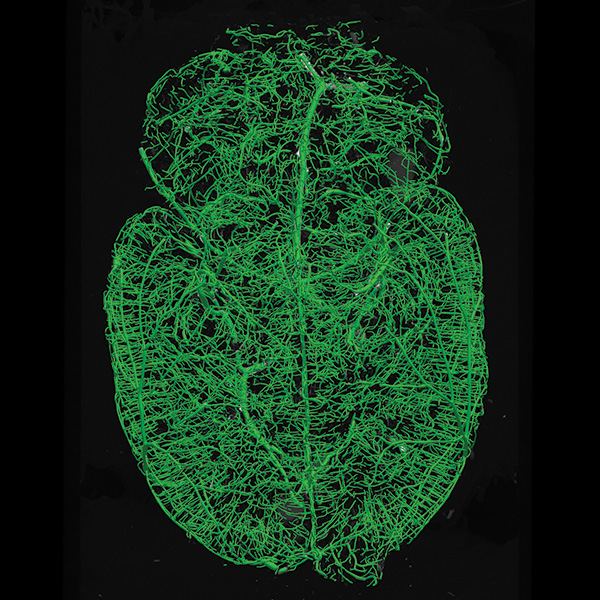
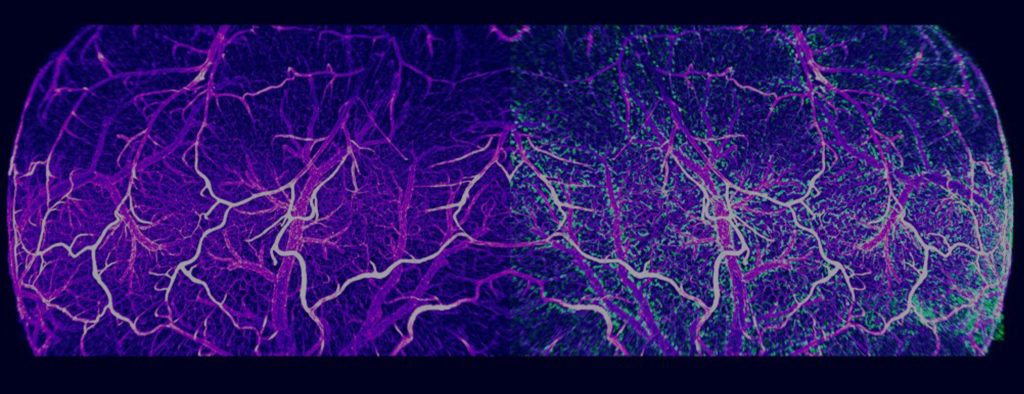
Model and quantify blood vessels from any organ and any species
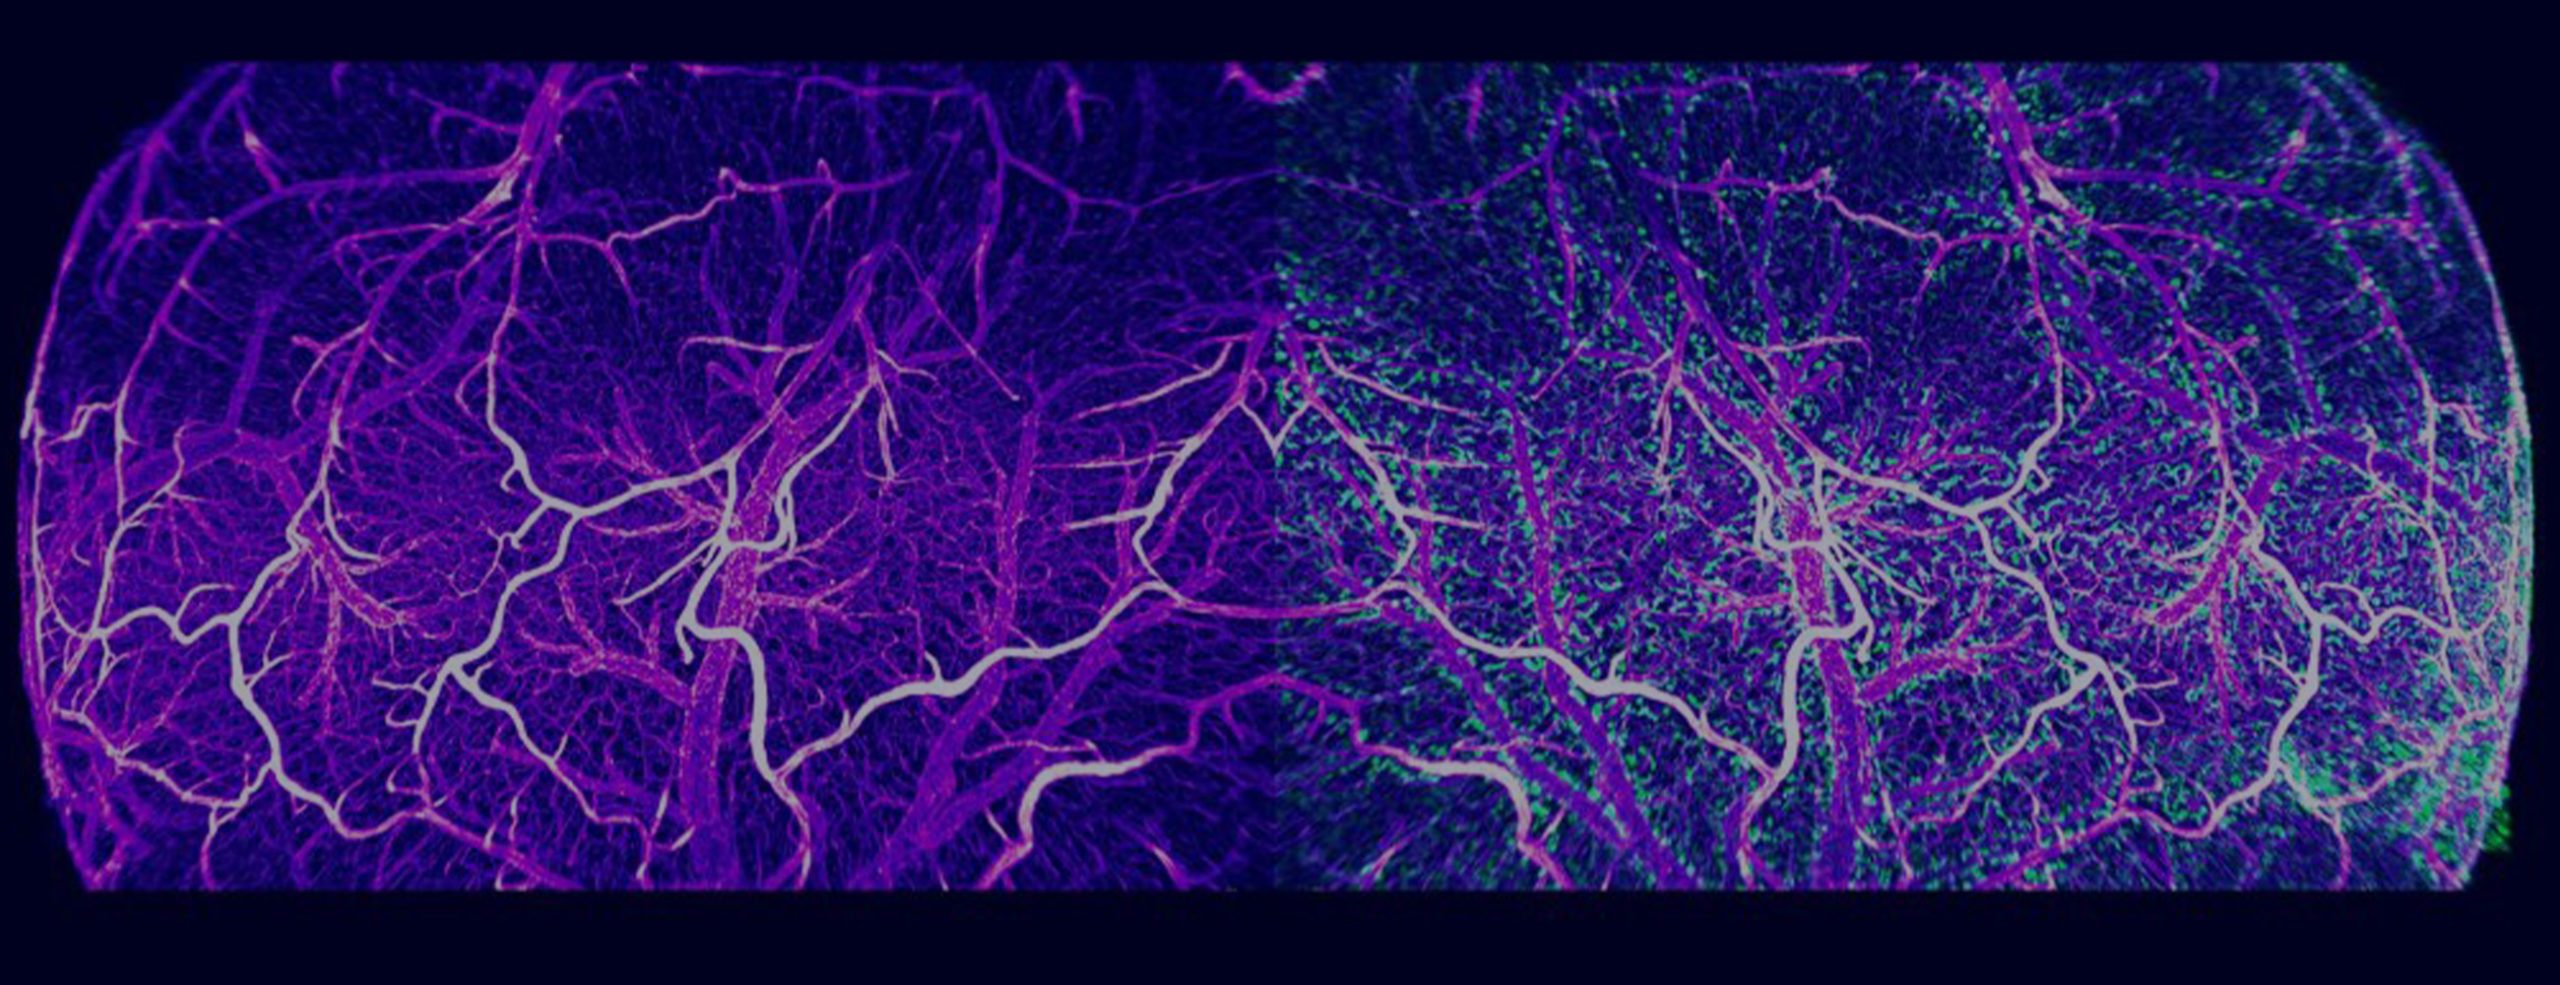
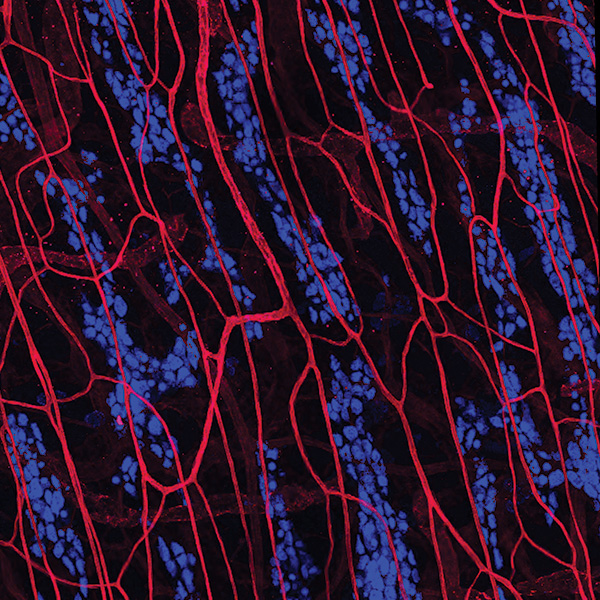
Characterizing and understanding the vasculature in the brain and other organs is fundamental to identifying disease mechanisms that can ultimately uncover new treatment opportunities. With Vesselucida 360, you can quantitatively characterize vascular architecture in healthy tissue and analyze changes due to injury, age, and/or disease states.
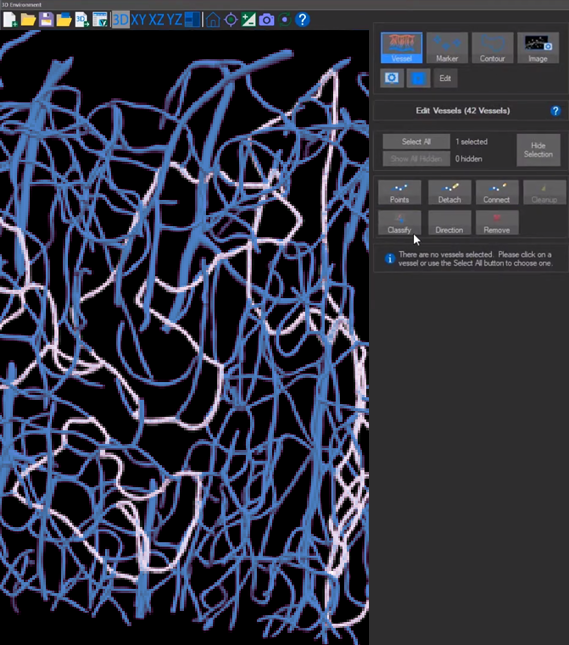
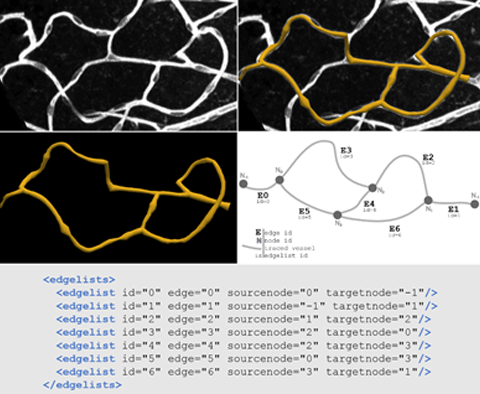
We engineered Vesselucida 360 to provide the research community with a comprehensive solution for quantification of microvasculature structures. With an intuitive 3D environment, automatic detection and modelling of vessels from 3D microscopy image data is not only possible, but fast and easy. Robust tools for viewing and editing both reconstructions and 3D image data enable users to validate and revise reconstructions if needed.
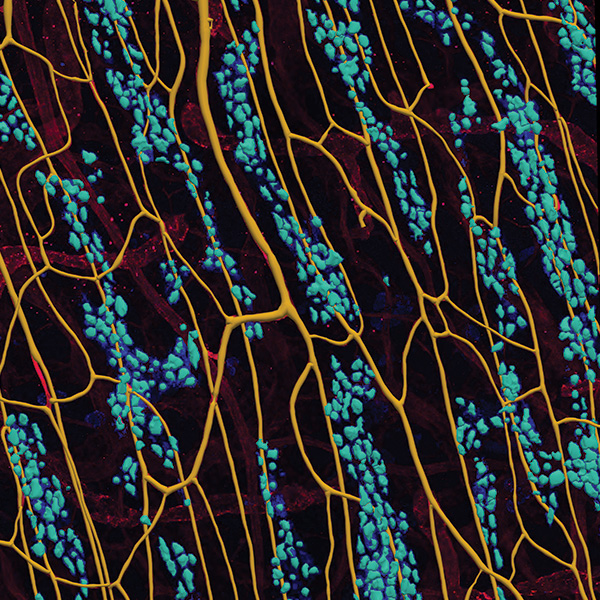
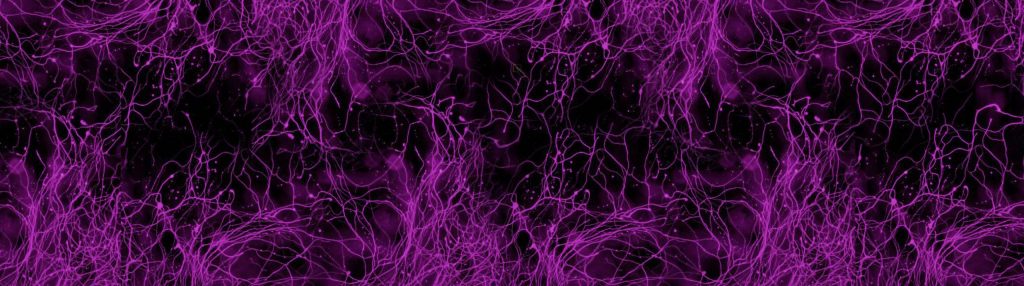
Vesselucida 360 works on vessels in any species from a variety of labeling and microscopy techniques such as:
Vesselucida 360 has been developed with support from the National Institute of Mental Health (NIMH)
Recommended Hardware Requirements
Vesselucida 360 is a powerful software that can work with a wide range of image data of vastly different levels of size and complexity. Because of its flexibility, our recommendations for system configurations vary to balance the affordability of lower computing power for smaller data sets to more expensive high-end workstations for large, multi-channel data.
Please contact us to consult with our technical specialists for a more precise recommendation specific to your data needs.
| 64-bit Windows 11 operating system |
| CPU with 8 cores (16 threads) or more. More cores improve performance when using large data sets (>1 GB). |
| Solid state hard drive(s). Preferably, non-volatile memory express (NVMe) drives. |
| 64 GB of system memory or more. More memory is better for large data sets, especially for image handling and reconstruction in the 3D environment. |
| Graphics card with 8 GB memory or more. Most graphics cards from NVIDIA and AMD have been tested with MBF Bioscience software. |
| Minimum Hardware Requirements |
|---|
| 64-bit Windows 10 operating system |
| 8 core processor (16 threads) |
| 32 GB memory |
| Graphics card with 6 GB memory or more: This is the minimum needed for the 3D environment, but is adequate for working only in 2D. |
| Computer-Hardware Upgrade Priorities |
|---|
| To upgrade your system for better performance with MBF Bioscience software, we suggest that you prioritize computer hardware upgrades as follows: |
|
|
|
Vesselucida Helps Researchers Quantify Post-Injury Capillary Damage and Regeneration
>> Learn More
New Therapy May Aid Heart Repair After Heart Attack
>> Learn More
Scientists use Vesselucida 360 to quantify brain vasculature in mTBI model
>> Learn More
Download Vesselucida 360 product sheet here.
View Full Version History Here.
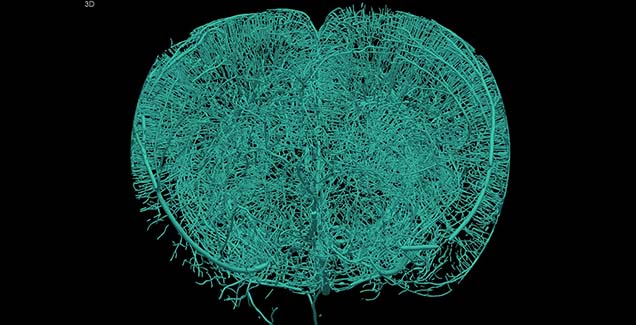
Automated reconstruction of vasculature in cleared, intact brain specimens


We are pleased to announce that the International Neuroinformatics Coordinating Facility (INCF) has endorsed the MBF Bioscience neuromorphological file format as
Our health depends on the ability of blood vessels to deliver nutrients and remove metabolic byproducts from organs and muscle systems.
Researchers Quantify Improvement in Heart Vasculature with Vesselucida 360 and Vesselucida Explorer Cells need oxygen to survive, but during a heart
Buncha, V., K. A. Fopiano, et al.
Mice deficient in endothelial cell-selective adhesion molecule develop left ventricle diastolic dysfunctionView Publication

Brady, E. L., O. Prado, et al.
Engineered tissue vascularization and engraftment depends on host modelView Publication

Jacobsen, N. L., C. E. Norton, et al.
Myofibre injury induces capillary disruption and regeneration of disorganized microvascular networksView Publication

Gama Sosa, M. A., R. De Gasperi, et al.
Late chronic local inflammation, synaptic alterations, vascular remodeling and arteriovenous malformations in the brains of male rats exposed to repetitive low-level blast overpressuresView Publication

Sullivan, A.E., Tappan, S.J., Angstman, P.J. et al.
A Comprehensive, FAIR File Format for Neuroanatomical Structure Modeling. Neuroinform (2021). https://doi.org/10.1007/s12021-021-09530-xView Publication

Gama Sosa, M.A., De Gasperi, R., Pryor, D. et al.
Low-level blast exposure induces chronic vascular remodeling, perivascular astrocytic degeneration and vascular-associated neuroinflammation. acta neuropathol commun 9, 167 (2021). https://doi.org/10.1186/s40478-021-01269-5View Publication
Button, E.B., Boyce, G.K., Wilkinson, A. et al.
ApoA-I deficiency increases cortical amyloid deposition, cerebral amyloid angiopathy, cortical and hippocampal astrogliosis, and amyloid-associated astrocyte reactivity in APP/PS1 mice. Alz Res Therapy 11, 44 (2019).View Publication
Yao, Y., Taub, A.B., LeSauter, J. et al.
Identification of the suprachiasmatic nucleus venous portal system in the mammalian brain. Nat Commun 12, 5643 (2021)View Publication
Jaffey, D. M., L. Chesney, et al.
Stomach serosal arteries distinguish gastric regions of the rat. (2021). Journal of Anatomy 239(4): 903-912. https://doi.org/10.1111/joa.13480View Publication

"I rarely have encountered a company so committed to support and troubleshooting as MBF."

"Vesselucida enables us to visualize and quantify microvascular networks in a way that has not been done before. The ability to render 3D maps is integral to analysis of network structure, remodeling and blood flow distribution."

"MBF Bioscience is extremely responsive to the needs of scientists and is genuinely interested in helping all of us in science do the best job we can."

"After examining different vessel quantification tools for use with neovessel formation in the heart, we chose to use Vesselucida 360 because it offered us flexibility in viewing and adjusting vessel geometries in 3D to accurately represent our microCT dataset. Also, the quantitative parameter extrapolation is excellent."

"I am so happy to be a customer of your company. I always get great help related with your product or not. With the experienced members, you are the best team I've ever met. All of your staff are very kind and helpful. Thank you for your great help and support all the time."

"We’ve been very happy for many years with MBF products and the course of upgrades and improvements. Your service department is outstanding. I have gotten great help from the staff with the software and hardware."

"Using Vesselucida, we were able to assess changes in resistance network architecture during muscle regeneration for the first time. We were limited by other imaging methods due to the network size and location of arteriolar networks within skeletal muscle. Vesselucida uniquely enabled us to reconstruct and analyze intact arteriolar networks in 3 dimensions with micrometer resolution over distances spanning millimeters to centimeters."
"The support team at MBF Bioscience has been great to work with. As a beta test site for Vesselucida, we are in constant communication. Their staff is professional & responsive to the problems we have identified & our requests for specific applications."
"Mapping microvascular networks are opening the door on novel aspects of microvascular perfusion. At this preliminary stage we are able to identify a fundamentally new perspective on oxygen transport. Very exciting to be developing this with you guys."